Marketing Mix Modelling: How can it be used in marketing planning?
Hold on a sec! You can now read this and other related blogs in my eBook:

Introduction
This is a follow-on from the two previous pieces that explored how marketing mix modelling works and what you can learn from marketing mix models about how your marketing channels work. Here, I will talk about three ways that you can apply marketing mix modelling outputs to enhance the marketing planning process.
To be clear, three ways that you can use the same outputs. My recommendation is to start simple and ‘upgrade’ over time. This is less of a risk than investing in a complex tool only to find later that it is more than you need or worse, unfit for purpose.
Marketing planning is not the only benefit of marketing mix modelling – more here – but it is the big one. that enhances, not replaces, existing marketing planning processes. Be wary of anyone who tells you that marketing mix modelling provides all the answers.
Quick recap
I included brief examples of how insights derived from those measures can help you to plan here. But what if you were more interested in over-arching marketing strategy rather than making tactical decisions about individual marketing channels?
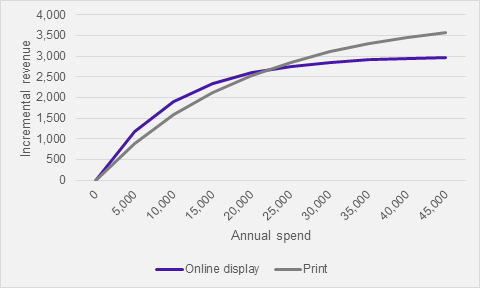
Response curves by media channel represent the return on investment of media spend at varying levels of spend. They provide an objective way of comparing the financial payback of media channels so that you can determine answers to questions like this:
a) for the same level of spend which channel delivers more sales?
In the chart below at annuals spends of £5k-15k online display delivers more than print
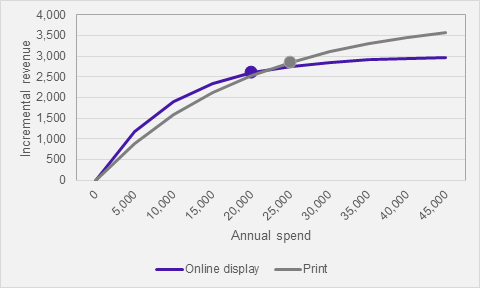
b) which channel is the best one to put your next £ into?
If you are spending £20k on Online display and £25k on Print you are better off putting the next available £5k into Print (+253) rather than Online display (+160). Even visually you can see the Display curve between £20-25k is not as steep as Print £25-30k
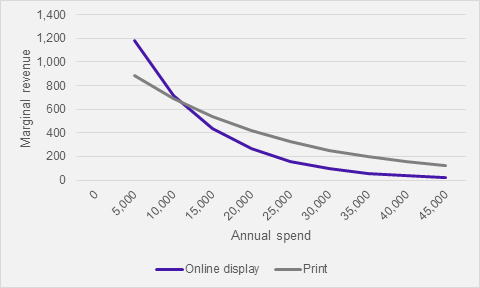
c) what is the maximum effective spend in each channel?
This shows the same data as a) except that rather than showing incremental revenue, only the extra revenue from the last £5k is plotted.
Although it is decreasing as spend increases (i.e. return on investment is falling), at every level of spend the extra return from Print is above 100.
But the benefit of putting extra money into Online display declines much more quickly and is arguably negligible beyond £35k.
Here are three ways to use response curves to help enhance your marketing plan:
There is probably already a process in place and increasingly these days it may use data-driven insights. For example, basing next year’s marketing budget on a % this year’s business performance. If marketing is not the only budget to be determined, perhaps the relative performance of marketing to other levers comes into play. And if multiple marketing channels are used channel performance may have been analysed.
There is no value to tearing up what exists already and replacing it with marketing mix modelling led outputs only to end up with a process that is less realistic than before. Especially if all the stakeholders are not yet on board. So, start simply:
- Keeping it simple
It may seem low-tech but do not undervalue just interpreting a set of plotted response curves, like the ones above. The backbone of decent marketing mix models is data legwork anyway. Here is why I would recommend doing this before 2 or 3:
- If the incremental impact of marketing is low are scenario tools worth the cost?
- If the differences between channel curves is very wide do you need a tool or is a more effective allocation already obvious?
- If curves suggest that all marketing channels are already beyond effective levels of spend then what to spend in total is a more important question than how.
- Scenario planning
The idea is to take a plan and a few alternatives developed elsewhere and use the channel curves to provide an estimate of the incremental marketing sales that each plan will generate. Compare across alternative plans to refine decisions.
Notice that this is not a full sales forecast, but a marketing sales estimation. Marketing mix models are not forecasting models. They are developed to explain the past in depth and not to predict the future granularly, so typically do not forecast time series well.
But the marketing sales estimation is as accurate as it can be, so this approach is useful to compare a) laydowns b) alternative spend levels c) alternative channel allocations. Within reason. The planned inputs need to be in the range measured by the model.
It is not wise to use this approach to estimate what doubling TV spend is. And it cannot be used at all to estimate the likely response for a channel never used. But it is flexible. An assumption that a new TV creative works 10% harder is easy to include.
- Optimisation
Optimisation tools produce the best plan to achieve a user-defined goal, given a set of constraints. For example: for a spend of £100k what marketing channel split maximises marketing sales if I spend on the same channels as last year +/- 10%?
They are like scenario planners in that curves from marketing mix modelling are the decision-engine. It is also possible to apply constraints. A planner builds constraints in so that the scenario plan inputs reflect them. In optimisation, it is an engine-setting.
One key difference is that the optimal plan may never be found using a scenario planning approach, but it is generated quickly in optimisation. Optimisation is also a more efficient choice if there are multiple countries, brands, and sub-brands.
Huge caveat: unconstrained or under-constrained optimisation will produce unworkable solutions. Minimum and saturation thresholds of what it is possible to buy in a week by media channel are a great example that only a marketing channel expert will know.
So even the most sophisticated of marketing mix modelling applications needs inputs from analyst, client, and agency (if marketing is outsourced) stakeholders before it can produce realistic, actionable plans.
Summary
A key output from marketing mix modelling are response curves by media channel. These curves provide a basis to objectively decide how to allocate spend between media channels in a way that reflects the relative payback of each media channel.
There are several ways that this can be done: manually - for want of a better description; by example - using curves as inputs to generate a scenario of a possible plan; by simulation - using curves as inputs to generate the most optimal plan.
For any of these, more actionable plans are developed if the response curves are used alongside real-world constraints. Financial efficiency will never be the only planning consideration. Non-financial goals and what is possible to execute matter too.
This concludes a trilogy that comprise an introduction to 1. how marketing mix modelling works 2. what can be learned about how marketing works 3. how outputs can be used to help plan. If you want to take a step back and learn what it is, read this first.
Please ask before reproducing my material partially or wholly for commercial use.
© Jo Gordon Consulting Ltd 2020