Marketing Mix Modelling: How does it work?
Hold on a sec! You can now read this and other related blogs in my eBook:

Background and other resources
This is a follow up to an earlier blog post in which I provided a no-nonsense overview of what marketing mix modelling is. That is not a technical explanation, but rather from the perspective of the business decisions that the approach can be used to support. There is more about the sorts of questions and the benefits of the approach here.
I have procrastinated a long time over this piece because it is difficult to write. Not because I do not understand well enough myself the concepts that I am trying to explain, just the opposite. Having practised for two decades, I take a lot of knowledge and leaps of understanding for granted.
But I do not expect to sell much of something that I cannot explain either, so here goes:
Key concepts: econometric and marketing mix
You may have heard of the term econometric to describe the same sort of models I talk about below. Econometrics is a general term for the type of statistical model. The marketing mix is an umbrella term for the collection of channels that a business uses. Think of marketing mix models as sub-type for models that can answer business questions related to marketing return on investment.
Key concepts: model
A model is just a simplification of reality that identifies and focuses on the most important explanations of “whatever it is” you are modelling. In marketing, this is typically some sort of sales metric, a universal shorthand for the short-term success of a marketing action. Let us say it is 3 years of weekly volume sales, for this piece.
To be able to identify what are the important drivers of volume sales, I need to collect data for as many of the real-world known drivers of sales over that time and test them. Many, but not all of these will exist in numeric form already. There may be others that are available in the public domain and a few that need some thinking to generate.
Modellers aim for the highest explanation of volume sales from the fewest number of variables. Logic dictates that if I do so I will have captured the most important drivers and it also makes working with the model more straightforward. After all, if a model is not simpler than reality to interpret, you are no further forward by undertaking modelling.
What about smaller drivers? Models can capture these, and modellers rely on statistics to isolate them from random fluctuations in sales (or “noise”.) A good example of this is perhaps a small but systematic upturn in sales every month around payday. Strategically important if you can exploit it by timing your marketing accordingly.
And everything else? The technical statistical term for the part of volume sales that the model fails to explain is “error”. It should be as small as possible, but it is far more important that it is random. Again, modellers turn to an array of statistics to determine whether the unexplained part of a model is acceptable.
There are limits. Imagine you are a business owner and you know from experience that when your main competitor launches a new product, it impacts your sales. If that has happened within the 3 years of volume sales included in the model, then it can be tested and measured in the marketing mix model.
If it happened 8 years ago and you no longer have data that goes back that far, it cannot be measured, even though you are sure that it is a driver of sales. That does not mean that when you are making plans you cannot allow for a competitive impact. You can, but that estimation will need to come from elsewhere, not this model.
So, variation is important, stuff needs to have changed to be measured. In fact, variation is the key concept that enables marketing mix modelling to work.
Key concepts: variation and incremental effects
I will start with a simple example and progressively make it more realistic. A business only does one marketing activity (promotions) and is the only seller in a market. Weekly sales may look something like this Fig. 1:
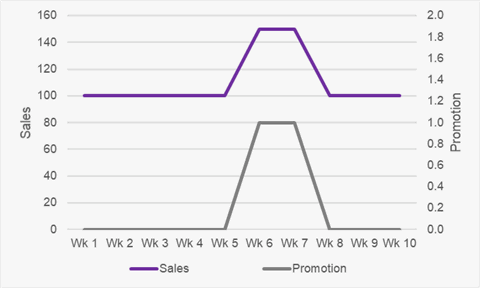 Fig 1: the very simplest of models
No model required. You can calculate the sales impact from a chart in this example. Usually your sales are 100 a week but in the 2 weeks on promotion sales are 150. So:
Total sales on promotion
150 x 2 = 300
Incremental promotion sales
150 x 2 = 300 minus 100 x 2 = 200
300 – 200 = 100
Incremental sales are the extra sales gained. Total sales in those time periods minus what you would have sold anyway. Marketing mix models measure incremental impacts from activity. This is different to other effectiveness methodologies so worth bearing in mind if you are comparing research. It is why marketing mix models can only measure activities that have happened in the model period because the incremental impact for sales drivers that have not varied is zero.
Key concepts: average responsiveness
We are staying with the monopoly business that just runs promotions. Promotions are run several times a year with various discounts. A reasonable starting point is that the sales responsiveness to promotions is proportional to the level of discount – larger discounts attract a higher sales response. Modellers move away from the simple 0 or 1 model input for promotions shown in Fig 1 to something like Fig 2:
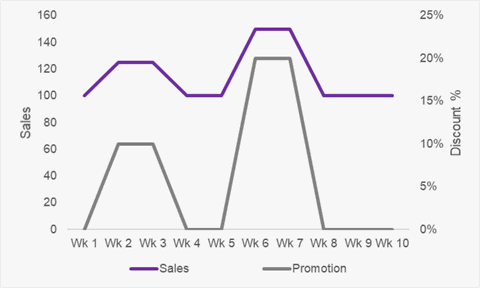 Fig 2: average response to promotions
For the first promotion the incremental sales response is +25% (125 – 100) and for the second promotion the incremental sales response is +50% (150 – 100). A more useful metric is the response relative to the size of discount. The sales lift to discount ratio for both promotions is 2.5 : 1 (+25% for 10% discount, +50% for 20%.)
In reality with three years of real-world data models do not produce such perfect estimations, but modellers again use statistics to determine if the simplification that they have chosen compromises the model (in this example the simplification is that the promotion uplift changes exactly in proportion to the discount.)
Notice that because there is still only one activity in our example a model is still not needed. A business owner could simply gather sales data over time and work out the response for each promotion then average those.
It is time to take it up a notch. What is the promotion uplift in Fig 3?
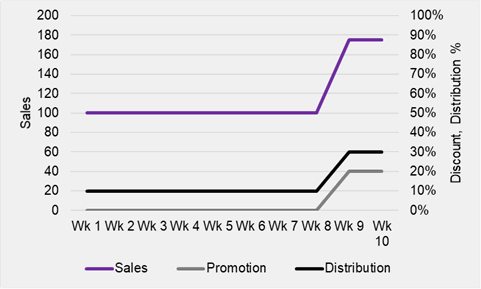 Fig 3: Marketing mix model impossible case
You cannot cheat and say promotions are 150 of the total 175 in weeks 9 and 10. This is a new scenario and the situations in Figs. 1 and 2 never happened.
The impossible challenge of fig 3 is that we are trying to disentangle two factors that change at the same time. It cannot be done without making assumptions about one or the other of the factors. That is exactly why marketing mix models typically use three years of weekly data to maximise the likelihood that there is enough variation in all the factors to tease the effects apart Fig 4:
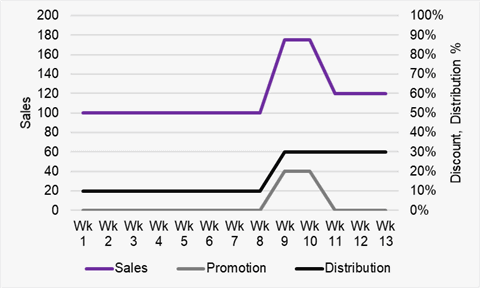 Fig 4: variation is crucial for marketing mix modelling
Now we are cooking with gas. When distribution increases in week 9 sales increase to 175 – but there is also a promotion happening. In weeks 12 and 13 sales are 120 but there is no promotion. The incremental impact just of distribution rising is +20 sales a week (120 – 100.) This means that the incremental impact of the promotion must be +55 sales a week (175 – 100 – 20.)
That is why marketing mix models typically use 3 years of weekly data because this increases the chances of a model being able to tease apart the incremental impacts of multiple sales drivers that are seemingly all flexing all the time. Even subtle effects that are not apparent by observation unlike my contrived examples.
Here is a final question though. In the earlier examples we saw that the promotion impact from a 20% discount was +50 sales. What explains the measure of +55 in the last example?
In all the earlier examples distribution was only 10%. The higher impact of +55 was when distribution is 30%. A reasonable interpretation is that consumers buying from the new outlets during the final promotion are more responsive to discounts.
Wrapping it up … for now
All I set out to do was explain how marketing mix modelling works, not chapter and verse of everything I know. I hope by explaining what a model is you are clearer about their purpose. And that I have cleared up any confusion you may have had about whether econometrics and marketing mix modelling are the same. I outlined how important the concept of variation is and that marketing mix models measure incremental not total impacts of activities.
By example I illustrated how models provide: an average response for each activity type; need enough time periods included to tease apart sales drivers when there are multiple activities; and can handle quite sophisticated real-world impacts like when promotion responsiveness changes depending on where a product is distributed.
Perhaps it is also now plain that building a useful marketing mix model requires a great deal of thought, both upfront to decide how to represent factors but also at the back end to interpret the outputs – so marketing mix modelling is definitely not a black box. But I also mentioned statistics several times – so neither is marketing mix modelling an approach that everyone can apply (well) without some statistical knowledge.
You may feel sold short because I have not even mentioned marketing mix modelling’s eponymous sales drivers: the marketing mix. The same concepts I have illustrated apply to any driver.
I will write more about how marketing channels are modelled in a future blog.