Marketing Mix Modelling: What can I learn about how marketing channels work?
Hold on a sec! You can now read this and other related blogs in my eBook:

Introduction
I may have ended my last blog frustrating some people by providing little detail about marketing channels. Here I outline why one of the core outputs from marketing mix models – return on investment – is a useful starting point for marketing spend allocation, a key benefit of the marketing mix modelling approach.
I explain what marketing mix modelling measures about how marketing channels work to show there is lots of detail behind an ROI metric. But I am afraid that I will probably disappoint again. Because this piece will end with the exciting possibility of using the model outputs to plan but stops short of explaining exactly how.
It is worth repeating that my aim is to write from the perspective of business decisions. If you are reading this as a practitioner, you may think that I am missing out information – this is deliberate. If you are interested in techniques, whether you have a technical background or not, please get in touch.
Overall purpose of marketing mix models
If I had to pick one aim of marketing mix modelling from the multiple benefits it is the measurement of return on investment (ROI) of marketing activities. Comparing ROI by media channel provides a starting point for optimizing a media plan. It is an output that makes marketing mix modelling a gold standard approach for marketing optimization.
Key concepts: return on investment (ROI)
ROI is a summary of media channel efficiency, calculated by dividing the incremental revenue (or profit) contributed by a channel by the channel spend over a fixed period. If revenue ROI is 0.5 it means that additional revenue from running the activity is only half of what it cost. An ROI of 1.5 it means that every £ spent on pays back £1.50:
TV revenue ROI = Incremental revenue from TV / Spend on TV
If a marketing mix model measures ROI across channels, comparing channel ROI is an objective way to allocate spend. This is very blunt and assumes that efficiency is the only metric that matters, but if TV ROI = 0.6 and Press ROI = 0.8 the next £ should be spent in Press because it generates 80p revenue (compared to 60p if spent on TV.)
Side notes on the complexities of ROI (can skip without missing out …)
- If the model metric is volume, it can be converted to revenue using average price
- Including promotional discounts or not in this price may have a big impact on ROI
- Apply margins to revenue if profit ROI needed (to compare across products)
- Costs typically exclude production (this is a sunk cost if copy is repeatedly aired)
- Measured ROI is short term. Long term is usually derived by applying a multiplier
Stakeholders must buy into ROI definitions and ensure that they are consistently applied across analyses. An easy definition of ROI is more useful for decision-making than a more accurate but complex calculation. Models are meant to simplify reality.
Key concepts: aggregate response
This piece explains how marketing mix modelling works. The modelled metric is aggregated sales. Individuals’ purchases are aggregated, and ROI reflects an average response. For strategic decisions this is better than a bottom-up analysis of transactions that tend to vary by individual, making the underlying pattern more difficult to measure.
Key concepts: incremental response
The measured effect of an activity is the incremental impact, the isolated additional sales not including those who would have bought it anyway. Not all media campaigns aim to generate sales though, so low ROI does not necessarily mean a poor campaign.
Consider these three examples:
- Campaign for innovation à the main aim is to drive awareness. Initially, awareness may be too low to generate sales. (Marketing mix modelling can also be applied to brand health metrics if they are robust and frequent enough.)
- Name-change campaign. Think about when Marathon went to Snickers, Opal Fruits to Starburst, Immac to Veet … à the primary goal is to not lose any existing buyers. A measured sales uplift of zero may signal a strong campaign.
- PR campaign. Think about oil spillages or product recalls à the aim is often damage-limitation. Unlikely to manifest as a sales uplift, but success may show up as a quicker recovery to typical “pre-problem” sales levels.
Marketing mix models tend to measure low ROIs for the types of campaign above, but no analyst worth their salt would recommend not spending on them, despite what a model says. This perfectly illustrates why very few analytics experts advocate for the complete automation of marketing mix modelling despite the available tech. It is a tool
The theory bit - what are the drivers of ROI?
I sidestep the question of what makes one brand’s marketing yield a higher ROI than another (Spoiler alert: category and brand size in relation to marketing spend are key drivers) and focus on what causes a brand’s ROI to vary over time:
- Scale/Speed of sales response - related to how considered a purchase is. Think of a mortgage versus a morning coffee Considered purchases need more messages to generate a response.
- How long sales impact lasts - related to memorability of the message. Think of a great TV advert from decades ago. Why can you still recall it? Memorable ads generate more for a given spend - some even years later.
- Synergy between channels - related to a whole being greater than sum of parts. Think how a campaign with messages on TV & online amplify each other. Synergy between channels should also influence planning decisions.
- Changes in other factors - related often to making products more accessible..
Think about the marketing effect if double number of stores are sold in. More available/visible/affordable increases potential marketing effect. - Marginal benefit of spend - related to returns to scale. Think - ease of 1st mile on bike vs. effort for 20th. Benefit of 1st cake vs 20th. What you get back for a £ spent changes as your total spend changes.
- Creative effectiveness - related to all sorts of things from copy wear-out to tone. Think about your reaction to advertising campaigns during covid-19, was it different to before? Even if media conditions are great, how a message resonates plays a part.
- Share of market - related to how much you can realistically spend. Think of real-world constraints like fixed budgets & presence of competitors.. ROI in a short-term period is limited by a brand’s current relative position.
Typically, the first five can be accounted for in marketing mix models to say something about how each contributes to ROI. Creative effect is subjective, but a different ROI between campaigns once quantifiable factors are accounted for may be due to creative. Market share is also an overlay that can explain differences in ROI across longer periods.
The practical bit – how is the marketing response measured in marketing mix models?
Some companies own proprietary advertising models enabling analysts to turn outputs into explicit recommendations quickly. They are great but only measure the same principles above – rooted in marketing theory, not unique to marketing mix modelling. If you are daunted by the term marketing response, do not be. It is simply a shape.
A shape that reveals something about ho marketing works. When a marketing mix model includes the non-media drivers of sales, what is left is the media impact. Analysts test lots of alternative shapes and watch what happens to the quality of the model before selecting the best based on statistical and common-sense criteria.
Scale/speed of sales response
A takeaway coffee is not expensive compared to a mortgage - it may even be an impulse buy. What this means is that if someone is going to be persuaded by coffee advertising at all they probably only need to see one or two messages to be convinced to try, or be reminded that the brand was one they previously liked.
Mortgages are different. Not all potential mortgage buyers are in the market at once. Those who are make long lists of brands, research product needs then make short-lists before doing anything. Mortgage marketers need to be exposing these potential consumers to their messages throughout this longer time-period.
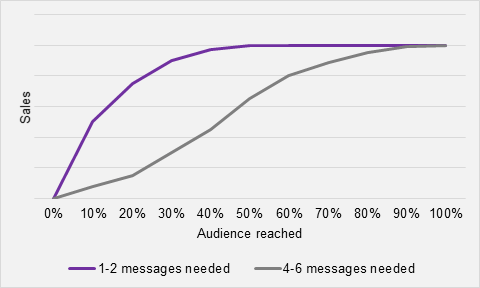 Fig 1. Response varies by type of purchase
How does this help plan?
If consumers only need to see one message before they will buy this informs the best channel options, frequency needed within a channel and minimum campaign spend needed. Compared to if they need to see more messages.
How long sales impact lasts
What was that ad you remember from years ago? Whether it is the music, visual content, annoyance quotient, comedic value, or product affinity - the memorability of messages varies. After buying once due to the ad the same consumer may buy again. Or, an ad seen a while ago triggers an initial purchase after the fact.
The impact on aggregate sales is the same; after the marketing stops there continues to be an impact on sales. This is modelled by measuring the speed at which this after-effect dwindles to nothing. The following examples are for 2 weeks of advertising where the effect decays at a) 50% b) 25% each week:
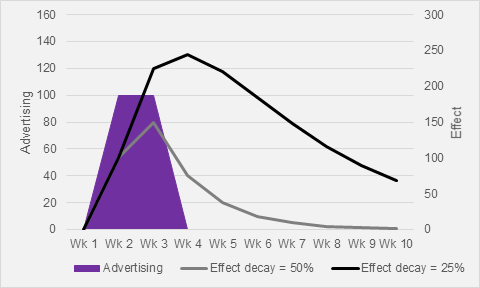 Fig 2. Impact lasts after marketing stops
How does this help plan?
If the decay is slow it means that campaigns can be more stretched out, for example by going week on/week off to cover a longer period. It also means that once reach has been built, weights can be lowered to avoid wastage.
Synergy between channels
A campaign deploys with TV and online video. The creatives are similar. If you run only TV, there is a measurable sales effect. Ditto for online video. When you run the copies at the same time the sales effect is more than the sum measured separately for TV and online video. This extra effect is channel synergy.
It happens if both channels are seen by the same consumer and when the messages amplify each other so that consumers notice them more. The key concept of variation is important - it is only measurable if there are examples in the model period where the channels have run separately and together:
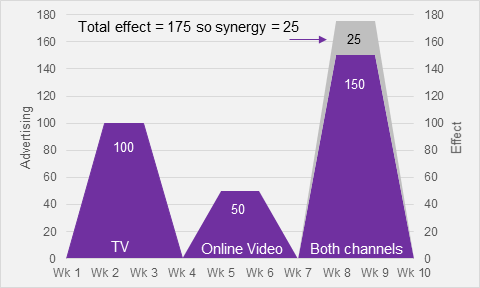 Fig 3. Synergy between marketing channels
How does this help plan?
If there is synergy between two channels, they should be planned with reference to one another not in isolation. Run them at the same time for an efficient boost to sales or lower the weights on each if this is not required.
Changes in other factors
Imagine you launch a product and convince just Asda to stock it in 315 of their stores (this is about half their UK stores.) You run a TV campaign and measure the incremental impact with a marketing mix model. It is very successful, and Asda agrees to roll out the listings of your product to all its stores.
If after that you repeated the TV what would you expect the impact of the second campaign to be? Imagine the only thing different about the second one was the number of stores. It could be as much as 2x the first impact, right? It was seen by the same people, but more who were persuaded by the ad could find then buy it.
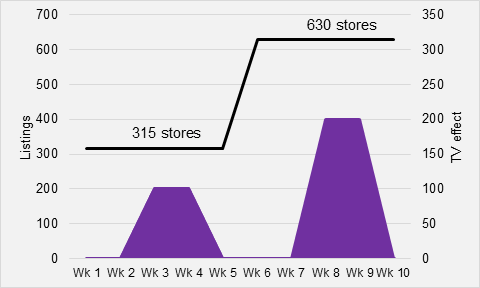 Fig 4. Other factors have impact on return
How does this help plan?
No matter how good your marketing, other structural business factors affect its return. If you know that the marketing effect varies with other factors make sure conditions will be favourable when you plan to run your next campaign.
Marginal benefit of spend
Imagine you have £75k to spend on marketing a product. You only advertise in one marketing channel and spend £5k on your first campaign. It does not cut through against competition and so has no measurable uplift. You spend £10k, then £20k on your next campaigns and the returns are good. You go for £40k.
You still get more sales than for your £20k campaign, but nowhere near double. If you plotted what you had measured for these four campaigns it will illustrate that diminishing returns to increasing spend set in between £20-£40k. To maintain efficiency (keep return on investment up) you must spend less.
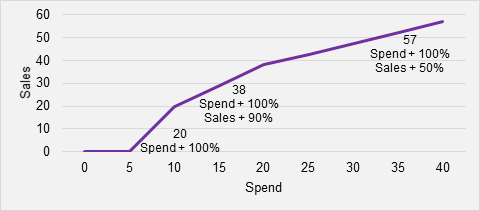 Fig 5. Returns vary with overall spend level
How does this help plan?
This is the big one. If you understand the marginal benefits of spending for all your channels you have an objective basis to allocate spend between channels. Even for spend levels you have not tried yet, up to a point.
Summary
Return on investment is a useful output from marketing mix models because it is a starting point for making decisions about how to allocate your marketing budget efficiently between channels. Return on investment is influenced by several factors and so it is a summary of how these factors combine to drive overall performance.
If marketing mix models are built to measure these factors it is possible to understand the individual impacts of them on return on investment. Measuring these effects separately can also provide insights that help planning. The biggest benefit are channel response curves that encompass all these factors and fuel budget allocation tools.
My next piece will explore how this information from marketing mix modelling (or other approaches) can be used to enhance a media planning process in practice.
Please ask before reproducing my material either partially or wholly for commercial use