How to start making data-driven decisions: the circular pathway
Introduction
If you are a business owner, you will be making decisions all the time using a process, although you may not be conscious of it. Including data into those decisions does not completely disrupt that flow, but it gives you an advantage. If used well, data is an objective outsider that weighs in not with opinions or motivations, but evidence.
For the most part, using it well just means being thorough and consistent. Being mindful not to just run with the first finding, nor only selecting information that supports what you already think or are going to do anyway regardless. It need not be complicated either, to begin with, nor ever. You can gradually work it into all your business processes.
Think of the data-driven part as a circular pathway. When you get back to the start you have new information that will allow you to:
- go around again at a higher level (spiral staircase)
- adjust course and repeat
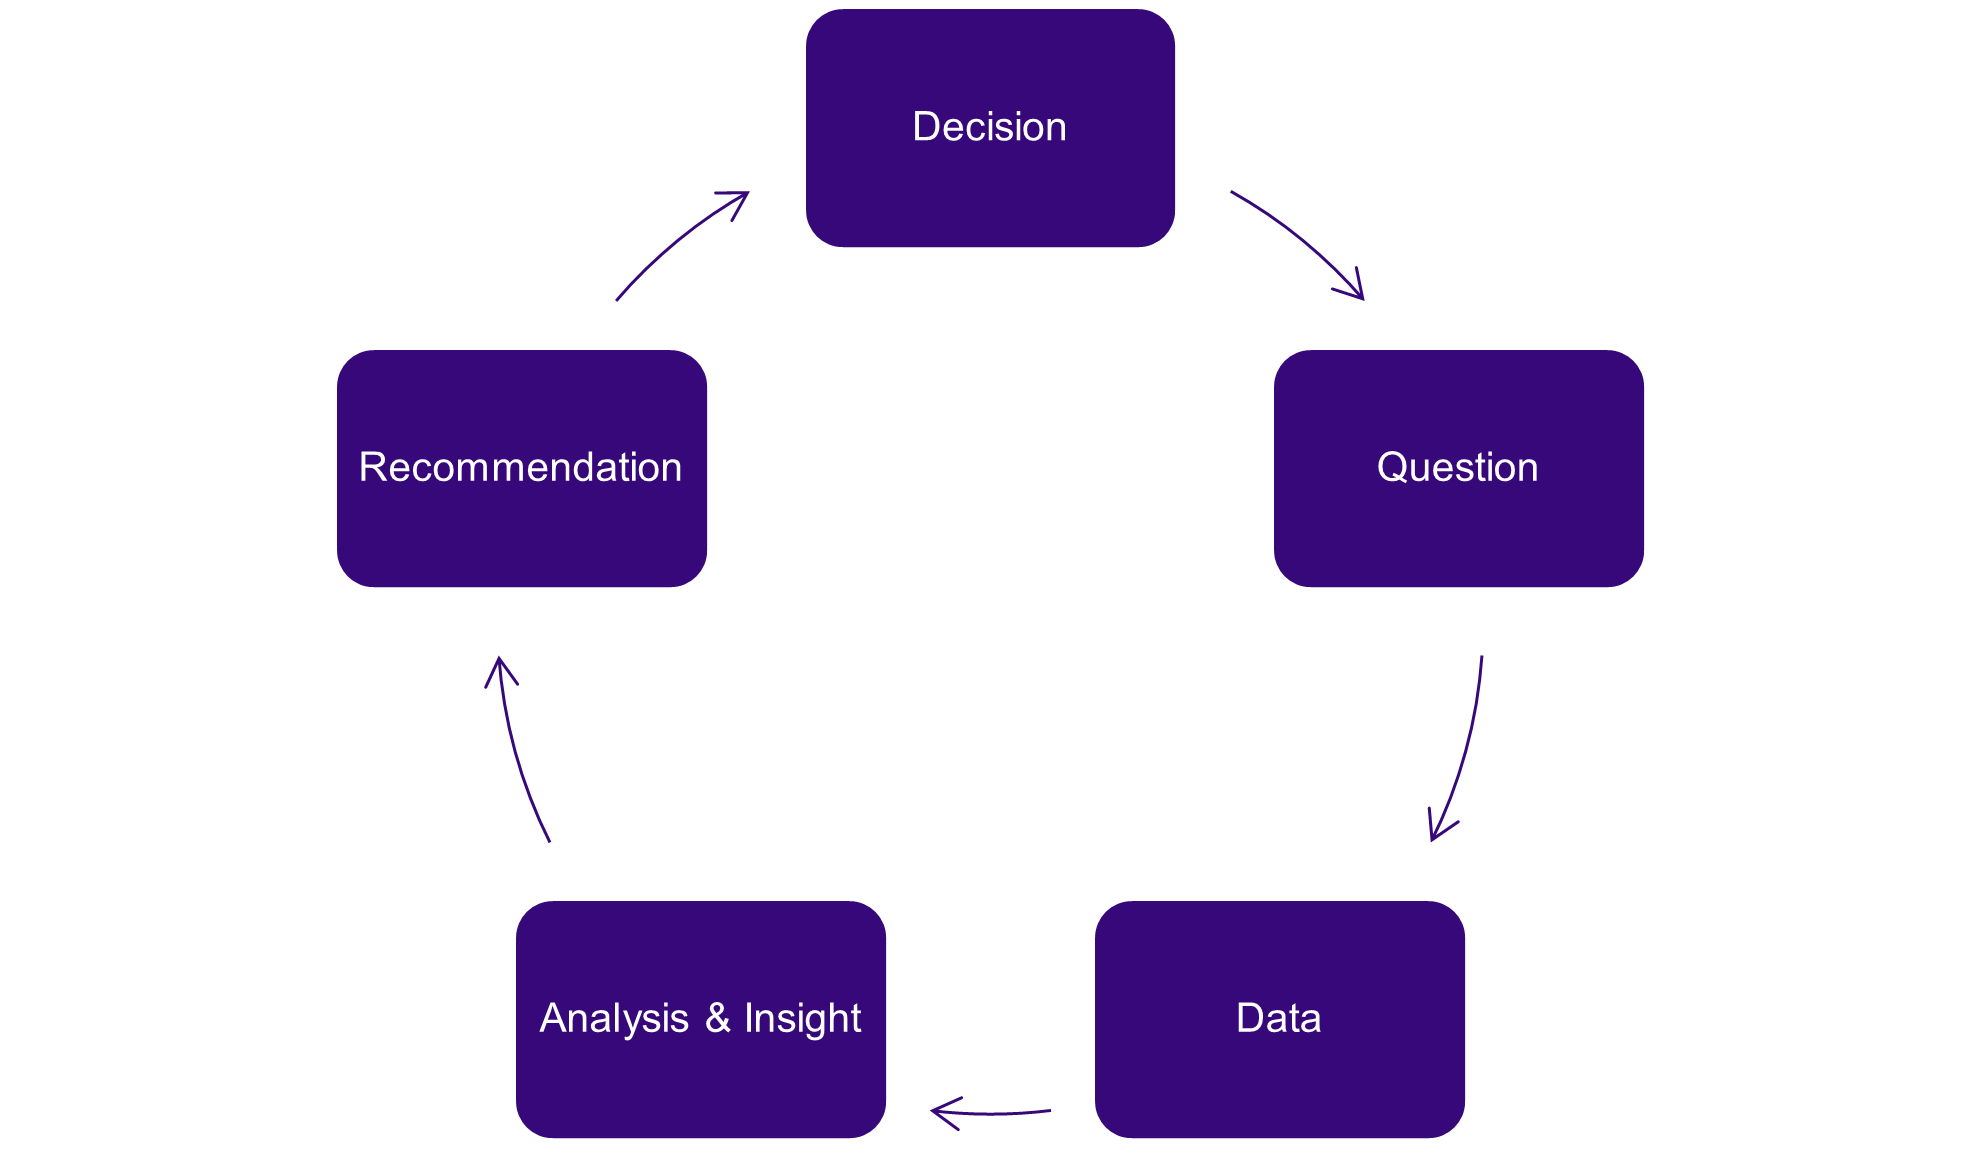
It is a circle, so where do you begin?
Question
Starting with a question is best because it keeps everyone who is feeding into the answer, including data, heading the same way. There will be different perspectives, see below for viewpoints on the question, “Should I run a promotion at Christmas?”
PURCHASING: is there a suitable product ready to promote?
FINANCE: what are the expected margins and how are they divided?
MARKETING: did the Christmas promotion work last year?
There will be information available for every perspective.
Data
Businesses sit on masses of data, a lot of which never sees the light of day because it tends to be held in digitally or filed neatly away. Simply having information at your fingertips does not equate to data-driven. Data needs to be actively worked with before it drives strategy, but it can be overwhelming because there is so much. Starting with a question lightens the load.
Here is a marketing perspective on the data to collect to understand, ‘did the Christmas promotion work last year?’
- If your business measures success as revenue, gather last year’s revenue. Do this by day or by week because the promotion does not run all month and shopping patterns vary depending on the days of the week the public holidays fall
- People buy more from you at Christmas, anyway, so also gather revenue for the previous two years as well. This will be especially useful in one of the past years has no promotion at all. That helps reveal what is really driven by just the promo
- Revenue is impacted by the discount given to the consumer. The best measure that reflects what the promotion caused consumers to do is unit sales. Pull that together for the last three Christmases as well.
- Also gather information on exactly when the promotion ran and what the discount was for the consumer was in case that makes a difference to the impacts on revenue or unit sales. Timing and the incentive may make a difference
- What else were you doing over the last few Christmases – advertising, being stocked in more outlets? A common analysis mistake is not to consider the bigger picture and conclude more importance on the promotion than is true
- Include November and January in the data you gather as well as December. Because consumers start to buy well before a large occasion. And a large expense may also mean that they buy less than normal in January
Notice how the data suggested is broader than just looking at business performance during the promotion. This example highlights some general principles that are worth bearing in mind when thinking about the data to gather to address a question:
- Include the measures you use to evaluate your business performance
- Include customer measures to track what they do & what you intend them to
- Make sure you can find out if what happened is typical or out of the ordinary
- There is usually lots going on so think of ways to rule out other factors
- Bring in some context detail about the activity in case that drives performance
- Timeframe can really make a difference to how you interpret success
- Get a head start by thinking of what good looks like for each activity you do
There may be some work to do before you have data that is ready for analysis. There are people who love this stuff and make light work of it, even if it is not your cup of tea. Data alone has no intrinsic value. It needs working with to unlock value.
Analysis & Insight
Analysis is just a structured & systematic look at some data. It may be as straightforward as producing and interpreting a table of information, or as complicated as running and translating a statistical analysis into plain findings. Just producing a table is not analysis. It is just the data laid out in a particular way. But it is a useful step because patterns sometimes jump out more in a table. Noticing a pattern and jotting some ideas about what that may mean, is analysis.
Then there is statistical analysis. Data is manipulated in particular ways. To show up relationships that are not visible by looking. These are skills that you can teach yourself, but it may be wiser to bring in a pro.
Here is one simple way forward with the promotion data suggested:
- Chart unit sales by week for the three years as 3 series on the same chart. Align the week of Christmas so they overlay each other. Add notes for when promotions start and end and a note on the level of discount for each
- Try to estimate what the extra unit sales uplift for the Christmas promotion last year was. Use the fact that in one year there was not a promotion and try to strip out the underlying trend that more people buy at Christmas anyway
- Repeat for revenue. The revenue compared to the unit sales impact should make sense when you consider the discount that was offered. Remember the discount may be give to all buyers not just those you identified as extra
- Repeat steps 1-3 for the other year that had a promotion. Tabulate the estimated uplifts by year against the promotion discount offered to see if there may be a link between size of offer and impact observed
- Mark on the charts what else was happening. If this bigger picture casts doubt on your conclusions so far then it may be wise to consider a more complex analysis that accounts for these other activities
- Find out if the interpretation changes whether you just look at December or take a broader view of the net impact across Dec & Jan. This can help determine if the activity is important to short- or longer-term performance
If anyone is interested in what that may look like, I plan to show some different types of data analysis in future blogs. Just writing it out highlights that data analysis is not a mysterious new world. Just a logical sift through evidence, guided by a question.
Watch out for analysis that is…
- just reporting. Good analysis goes further, is interpretive not just observational
- too narrow. Not considering the bigger picture often leads to inaccuracies
- not objective. Analysis where data is cherry-picked to fit a belief is not useful
Analysis is an activity that uncovers insights hidden in data. Insights do not come from nowhere. Sometimes several pieces of analysis are combined to produce insight. Think of these as pieces of a jigsaw, only by looking at several do you see something new:
- Unit sales peak at Christmas even if there is no promotion or other marketing activity. This is only an observation on its own. If you were to do more analysis to find out if it was regular customers buying more, or new customers only buying the product at Christmas you are entering insight territory
- Promotions at Christmas lead to higher sales. This sounds like an observation too, but if you can say how much higher because you have combined analysis on seasonality with analysis on overall sales trend it is an insight
Watch out for insight that is…
- just analysis. Insights are broader, providing new understanding
- stated without a clear trail back to analysis and data
Recommendation
Making recommendations is the goal of data-driven approaches, but they are often missing. This may signal that the analysis has not gone deep enough, but it may also be because whoever has done it does not understand the business context enough. Catch-22. You may not have the time, inclination, or expertise to do data or analysis work, so you hire somebody. It is unlikely that they know your business exactly so what you end up with is not useful. Pick independent but collaborative partners.
Decision
Data-driven recommendations come from your extra team member, the objective outsider who weighs in with evidence. You will not in practice only heed that one voice, for more on why read this. To decide whether to run a promotion at Christmas you would compare the recommendations that come from looking at the same question from different perspectives e.g. purchasing, finance, marketing. If they conflict you would still have a basis for a discussion where you could assess how robust and firm each recommendation was. Based on what your overall business priorities are, make a choice with a broad understanding of upside and risk.
Closing the loop
Whatever your decision ends up as, best practice is to gather the relevant data, do some more analysis and evaluate whether you made the right choice. Closing the loop and re-evaluating past decisions keeps businesses moving forwards. Want more ideas about how to get started, or a chat about how to approach a business question that you have in this way? Give me a call or drop me a line.
Please ask before reproducing my material partially or wholly for commercial use.
© Jo Gordon Consulting Ltd 2020