Want to be easily organised and amazingly efficient? Get in bed with spreadsheets.
Introduction
Spreadsheets get criticized and overlooked both by data experts and people with less of a geek streak than me. Some data people shun them for sexier interfaces or code-driven packages. Others mistakenly believe that spreadsheets need to be difficult or technical.
The truth is that the daddy, Excel, and its brother from another, Google Sheets, are versatile, multi-function packages suited to a whole range of tasks. Most people, even power-users, only ever themselves use a small proportion of the functions that these packages have on offer.
There are thousands of online guides, courses, videos that teach you how to use functions in spreadsheet packages but many of these already assume that you are a user or have a specific task that you want to achieve.
What I want to do here is go right back to basics, then give a little taster that showcases how they can help.
What is a spreadsheet?
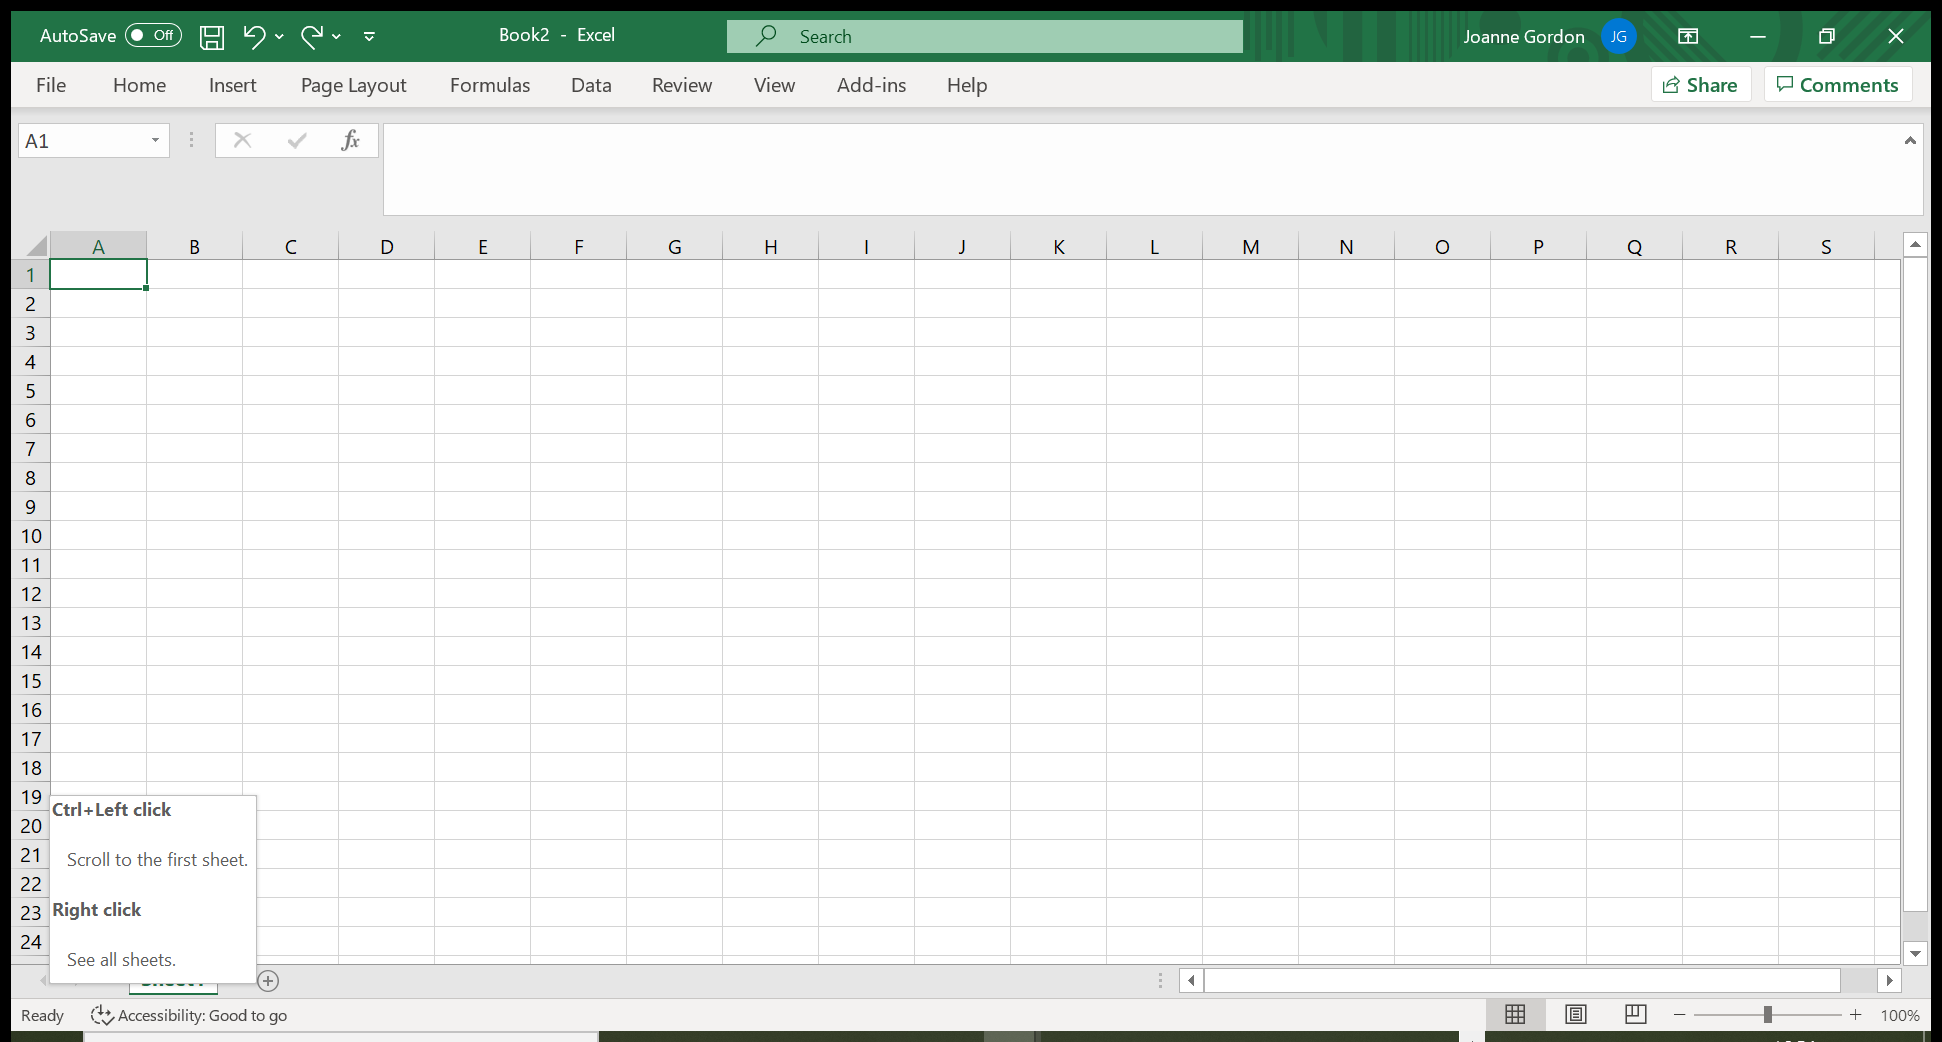
Wikipedia says it quite well. It is just an electronic document, a grid with rows and columns. I still get a shiver of endless possibilities when I see the blank canvas of a spanking new clean sheet, but I appreciate that it fills others with dread. In much the same way as a blank Word doc does for me.
Spreadsheets have their roots in finance, early uses were digital accounting ledgers. But spreadsheets can store text information too. Their power is really about the ability to neatly store, label, update and do calculations on that stored information. For that reason, I have just ditched my CRM system for Excel. More on that later.
Spreadsheet packages
For quite a long while if you wanted to do anything serious, it had to be Excel. There are now many free alternatives that contain plenty enough functions for light to mid- users. In terms of collaboration, Excel is still playing catch up to the NKOTB.
- Excel. You need an Office subscription of some kind to use this
- Google Sheets. Need a Google account, but otherwise free
- Zoho Sheet. Freemium model
- OpenOffice Calc. Open-source freeware. Excel-esque
- LibreOffice Calc. Open-source freeware. Excel-esque
- Apple Numbers. Best graphics
- Airtable. Best integration with project management, databasing.
Here is a handy post that compares five packages. I have used the first three packages and broadly agree with TechRadar’s views, although I disagree that the learning curve for Excel needs to be steep. These days I use Excel for work and Google Sheets for life admin.
Spreadsheet example: simple CRM system
There are loads of commercial CRM systems that you can subscribe to for free and I did for a while. But my needs are quite simple so when I found myself exporting data out of the platform to be able to do some analysis on it, I realised that I would be better off just keeping the list in Excel in the first place.
Purpose
Securely and neatly input, store, organize and interrogate information for all your contacts, past and present.
Design Make a list of the pieces of information that you would like to collect about each contact (row). These will become the headings for spreadsheet (columns).
Function
Using a spreadsheet as the basis for a CRM means that with a little know-how you can add custom-designed features to help you stay on top of things. Here are a few:
- Filters: to look at specific contacts that meet a criteria
- Data validation: restrict how information is input to keep those sheets clean!
- Conditional formatting: to help you see when a task is overdue
Example
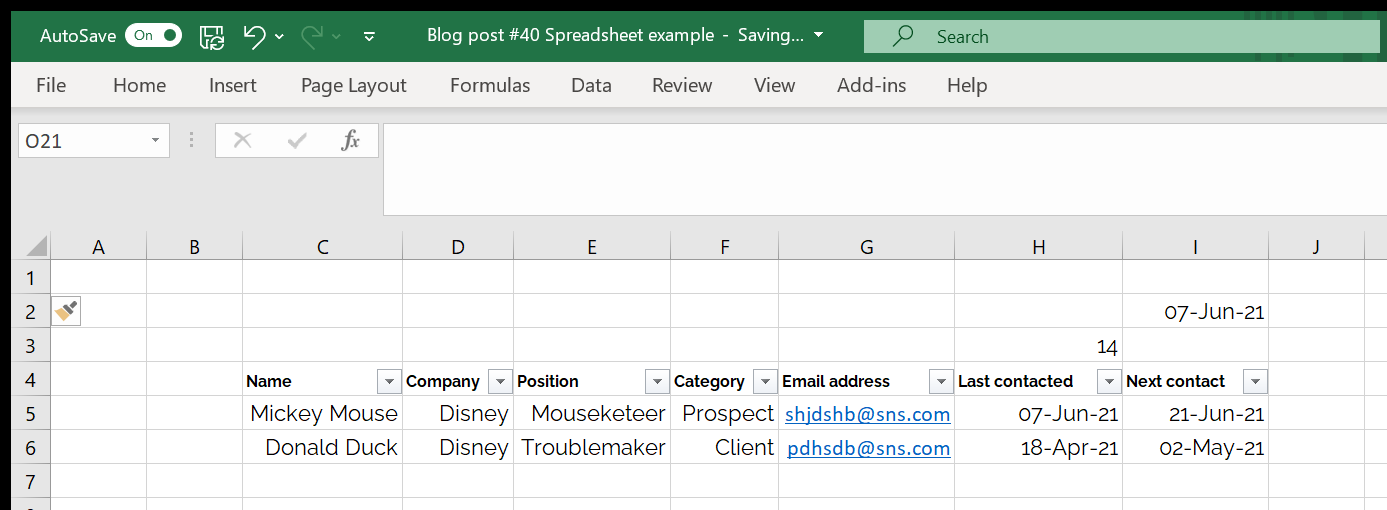
There are just 2 entries in the CRM system below, for two individuals from the same company.
There is some basic information but design your own in a spreadsheet package and you can be in total control of what these headings are.
With not much data you don’t really need to filter, but imagine that your system had 2,000 entries.
Filters
The tell-tale that information can be filtered is the little arrow you can see to the right of each column heading. But how do you get it and what does it do?
Go to the row you want the filter on (it is 4 above) and click on the 4 over on the left. That will select the whole of row 4 and turn it grey.
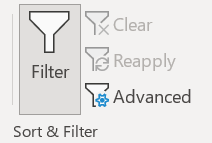
Don’t click away, go straight to the top menu and select ‘Data’ then ‘Filter’ from the options. It has a funnel-like symbol. Your arrows should now appear.
Now you can filter the rows by any of the columns that have an arrow on them. For example, if you just want to look at Prospects and ignore Clients:
- Click on the arrow next to Category
- Check the box next to ‘Select All’ so that nothing is selected
- Check the box next to ‘Prospects’ and then click OK
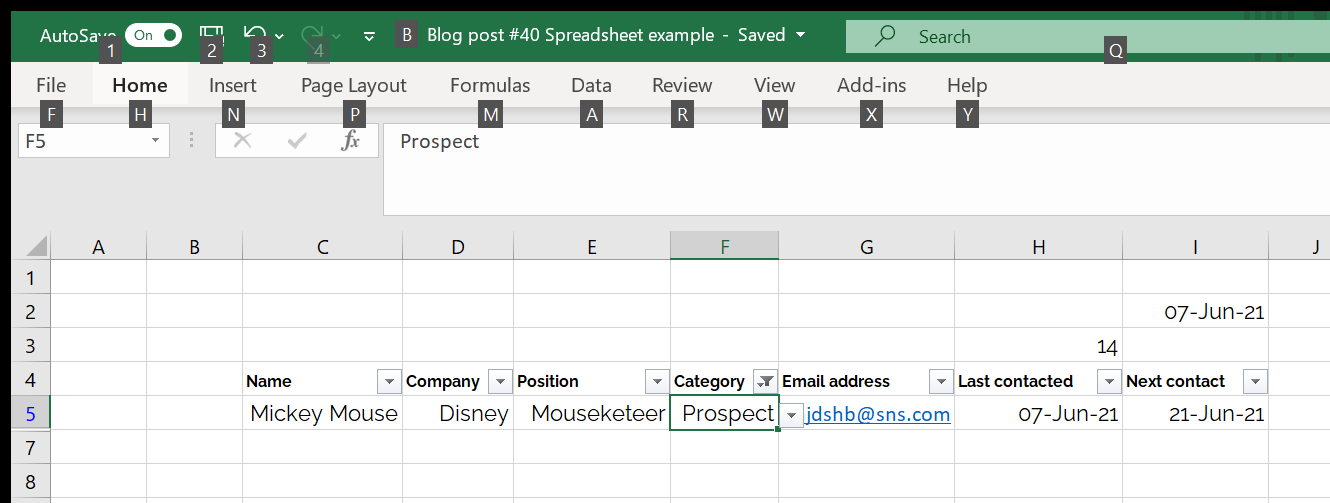
You know if something is filtered in a spreadsheet because the little arrow changes to a funnel.
With bigger spreadsheets you can filter on more than one column at once to drill down from looking at everyone to a very specific group. More here.
Data validation
For something like the type of contact (‘Category’ in this example) there will be a limited number of acceptable options, so make this column a dropdown. How?
Make a list of the options you want to be able to choose from somewhere. In the example above it is over to the right past the main table.
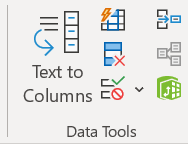
Go to the first entry in the Column you want to place a restriction on. Go straight to the top menu and click Data, then find the Data Validation under Data Tools (right of Filter):

- In Settings under ‘Allow’ change Any Value to ‘List’
- In Source, type in the range where the list you created is sitting
- Click OK
You can get really fancy and give users a custom message before they input data or a specific error message if they attempt to free type a non-valid entry.
I don’t usually bother unless I am working on something that lots of other people will use. More guidance.
Conditional formatting
In this example there is a column to enter the date when last contact was made. Imagine you want to be reminded to follow up on a fortnightly basis.
The fab thing about excel dates if you enter them as dates is that you can treat them like numbers. So rather than working out the next contact date, it is a formula:
Mickey Mouse ‘Next contact’ = 21st Jun 2021 which is 14 days after ‘Last contacted’. I didn’t type in 21st Jun 2021. Instead, I put in a formula: = Last contacted + 14.
The beauty of that is that I can update ‘Last contacted’ with a new date when I do next speak with them, and the ‘Next contact’ will update again automatically.
I made overdue actions really "pop" by using conditional formatting. So, I didn't manually colour the cell red below. It is done automatically because the contact date is overdue.
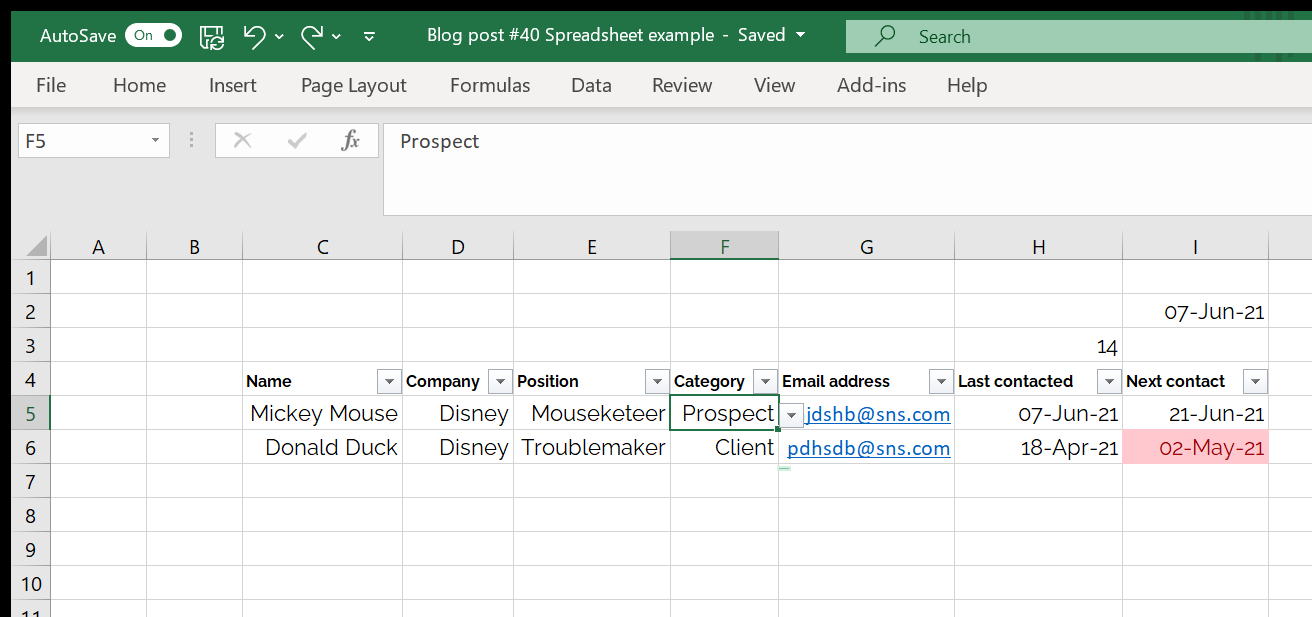
This set of tools changes the “look” of your cell if it meets certain conditions. The cell turns red if the ‘Next Contact date’ is before today’s date. [ FYI, =TODAY() ] is a formula that updates each time a spreadsheet is opened.]
You can do absolutely loads with conditional formatting and here is a great piece about it.
Wrapping it up
Spreadsheets are for more than just numbers and I have shown a tiny fraction of what you could do here, just for one use case.
They are great for storing important business information in a format that can be easily updated and used to make decisions efficiently.
If you would appreciate a chat with a spreadsheet lover (no course to sell) get in touch.
Please ask before reproducing my material partially or wholly for commercial use.
© Jo Gordon Consulting Ltd 2021